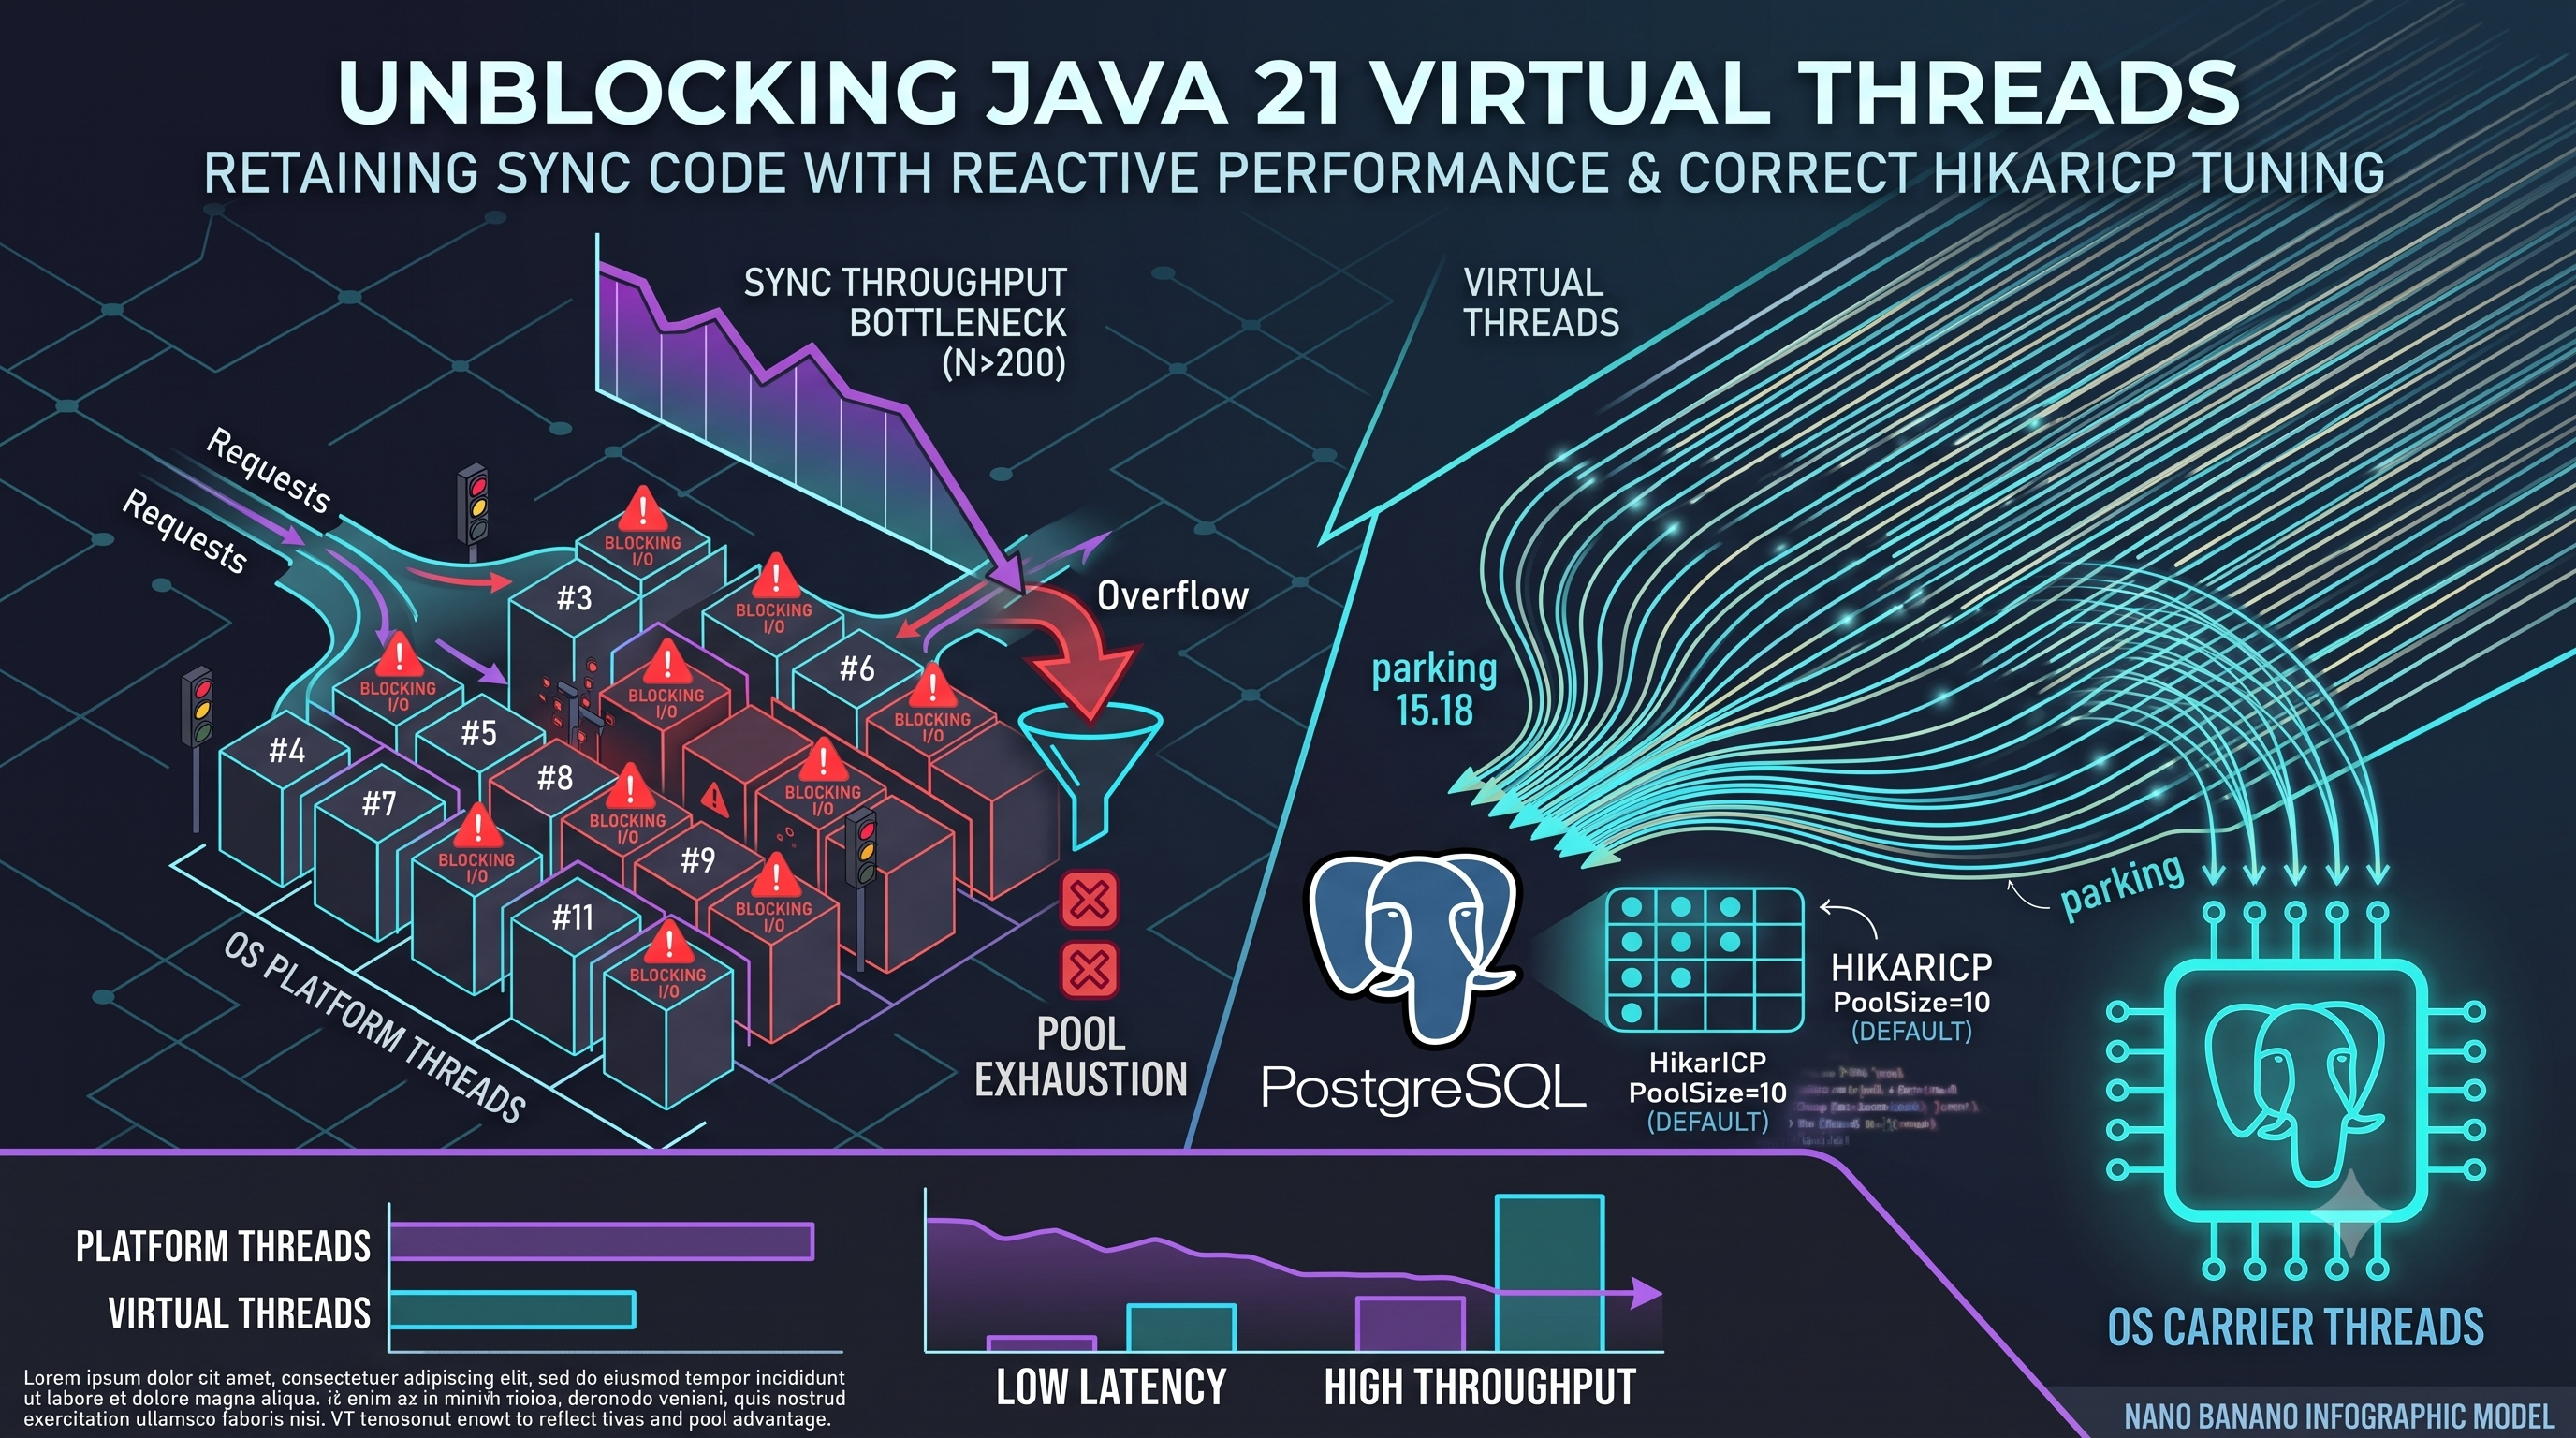
I benchmarked virtual threads at 500 concurrent connections. The throughput gain was real — but the bottleneck it revealed was not what I expected.
In this article we examine how Virtual Threads reshape Java’s concurrency model, uncover the hidden bottleneck of connection-pool sizing, and present an empirical benchmark using k6 load generation, Spring Boot 4 with four configuration profiles, and a standing PostgreSQL 15.18 instance. The results quantify performance differences between traditional platform threads and Virtual Threads in I/O-bound Spring WebMVC workloads, and reveal where virtual threads cannot help at all.
1. Introduction – The Thread-Per-Request Model and Its Limits
Since the early days of the Servlet API, Java EE applications have relied on a simple thread-per-request model: each incoming HTTP request is handled by a dedicated java.lang.Thread. This approach is easy to understand and debug, but it incurs a heavy cost because OS threads are heavyweight. A typical Java platform thread reserves about 1 MiB of stack space plus additional kernel metadata, and each context switch requires a full kernel transition. As Brian Goetz et al. detail, this memory and scheduling overhead quickly becomes a scalability bottleneck (Goetz et al., 2006).
Because of these costs, containers such as Tomcat impose a default maximum thread pool size (e.g., server.tomcat.threads.max=200 in Spring Boot). When an application receives more concurrent requests than there are available threads, the excess requests are queued, leading to increased latency and reduced throughput.
To address this limitation, many developers have turned to reactive programming with Spring WebFlux and Project Reactor. Reactive streams enable non-blocking I/O and event-loop architectures that can handle many more connections with far fewer threads. However, this model introduces its own challenges: a steep learning curve, intricate debugging, and a fundamentally different programming paradigm.
2. The Virtual Thread Paradigm Shift
Java 21 introduced Virtual Threads via JEP 444. Virtual Threads are lightweight, user-mode threads that are not bound 1:1 to OS threads. Instead, they utilize an M:N scheduling mechanism, where millions of virtual threads are multiplexed across a small pool of OS “carrier” threads.
When a virtual thread executes a blocking I/O operation (like a JDBC call or a socket read), the Java runtime automatically unmounts the virtual thread from its carrier thread, freeing the carrier to execute other virtual threads. When the I/O completes, the virtual thread is remounted. This allows developers to write simple, synchronous, blocking code while achieving the throughput characteristics of asynchronous reactive code.
2.1 Spring Boot 4 Integration
Spring Boot 4 natively supports Virtual Threads. Enabling them requires no code changes to the business logic; it is purely a configuration shift. By setting the following property, Spring Boot reconfigures the embedded Tomcat server to use an ExecutorService backed by virtual threads:
spring:
  threads:
    virtual:
      enabled: true
Under the hood, Spring Boot configures Tomcat to use an ExecutorService backed by virtual threads (an internal implementation detail).
3. The Hidden Bottleneck: Connection Pooling (HikariCP)
While Virtual Threads eliminate the bottleneck of thread exhaustion, they immediately expose the next bottleneck in the stack: resource exhaustion.
Virtual threads are virtually free to create, but physical database connections are not. Spring Boot bundles HikariCP for connection pooling, and its maximumPoolSize defaults to 10 (see HikariCP’s pool-sizing guidance).
If we enable Virtual Threads and send 5,000 concurrent requests to an endpoint that executes a database query, the application will instantly spawn 5,000 virtual threads. However, 4,990 of those threads will immediately block, waiting to check out a physical connection from the Hikari pool.
While virtual threads handle this blocking state much more efficiently than platform threads (no OS context switching), the throughput of the application is still strictly capped by the database connection pool size. Therefore, enabling Virtual Threads without tuning HikariCP yields suboptimal results. The pool size must be scaled to match the database’s capacity to handle concurrent connections, rather than the application server’s CPU core count.
4. Empirical Validation: Benchmark Methodology
To quantify the impact of Virtual Threads, we constructed a benchmark that isolates the threading model from application logic. The setup uses a standing PostgreSQL 15.18 instance, Spring Boot 4.1.0 with four configuration profiles, and k6 as an external load generator.
4.1 Environment Setup
The benchmark runs against a real PostgreSQL database — not an in-memory mock. PostgreSQL 15.18 runs in a Docker container on a separate machine (10.0.0.59), with max_connections raised to 1000 to avoid database-side connection limiting.
The Test Machine
The application runs on my daily driver, so the numbers below are what I’d expect from a reasonably current mid-range desktop rather than anything exotic. It’s an Intel Core i5-9600K at 3.7 GHz — six cores and six threads with no hyper-threading, which matters more for this benchmark than you might think: it means the CPU is a real ceiling and the platform can’t lean on extra logical cores to paper over scheduling behavior. It also means the carrier pool we configured has exactly six physical cores to run on. The 32 GB of DDR4 RAM was plenty for the JVM and the workload, and the benchmark’s file fixtures lived in tmpfs, so we weren’t measuring disk throughput at all.
| Component | Spec |
|---|---|
| CPU | Intel Core i5-9600K @ 3.70 GHz, 6 cores / 6 threads (no hyper-threading), turbo up to 4.6 GHz, 9 MiB L3 cache |
| Motherboard | Gigabyte Z390 AORUS ELITE-CF |
| RAM | 32 GB DDR4 (4 × 8 GB Corsair, 2133 MT/s) |
| Storage | 1 TB SanDisk SSD + 2 TB Samsung 870 EVO SSD + 1 TB WD HDD (fixtures used tmpfs, not disk) |
| OS | Ubuntu 26.04 LTS, kernel 7.0.0 |
| Network | Intel I219-V Ethernet (benchmark DB accessed over the network) |
| Database | PostgreSQL 15.18 in Docker on a separate machine (10.0.0.59), max_connections = 1000 |
The two specs worth flagging are the six-core CPU and the isolated database. Because there’s no hyper-threading, the CPU-bound file workload’s behavior here is a clean function of those six real cores — results will shift on a chip with more logical threads. And keeping PostgreSQL off the test box means the application and the database never fight over the same cores. If you reproduce this on a single machine, expect both to compete for the same CPU and the numbers to get a bit muddier.
The application exposes three endpoints:
-
GET /api/slow-query— executespg_sleep(1)viaJdbcClient, holding one Hikari connection for exactly 1 second. This is the database I/O workload. -
GET /api/fast-query— executesSELECT 1 AS benchmarkviaJdbcClient, a constant-time probe with no table access, no I/O, and deterministic output. This isolates the thread model from database latency. -
GET /api/file-read— reads 256 MiB from tmpfs and computes a per-byte checksum. This is the CPU-bound workload.
4.2 Simulating Blocking I/O
Rather than creating dummy tables and complex queries, we leverage PostgreSQL’s built-in pg_sleep() function to simulate a deterministic 1-second blocking I/O operation.
package com.example.demo.benchmark;

import lombok.RequiredArgsConstructor;
import org.springframework.jdbc.core.simple.JdbcClient;
import org.springframework.stereotype.Repository;

/**
 * Repository for the slow-operation benchmark.
 *
 * <p>The benchmark has no domain model, so a thin {@link JdbcClient}-backed
 * repository is clearer than introducing a JPA entity solely to execute a
 * native function. The query holds one physical JDBC connection for one second.
 */
@Repository
@RequiredArgsConstructor
public class SlowOperationRepository {

    private final JdbcClient jdbcClient;

    /**
     * Simulates a deterministic one-second blocking database operation.
     *
     * <p>{@code pg_sleep(1)} parks the backend for exactly one second,
     * holding the JDBC connection (and therefore one Hikari pool slot) for that
     * period. It is the sole throughput cap in this experiment.
     */
    public void simulateSlowDatabaseCall() {
        this.jdbcClient.sql("SELECT pg_sleep(1)").query().singleValue();
    }

    /**
     * Executes a fast, constant-time probe against PostgreSQL.
     *
     * <p>{@code SELECT 1} is a constant scan with no table access, no I/O and
     * deterministic output. It is used as a low-latency baseline for the benchmark.
     *
     * @return the constant {@code 1} returned by the database
     */
    public int fastDatabaseCall() {
        final int value = this.jdbcClient.sql("SELECT 1 AS benchmark")
            .query(Integer.class)
            .single();
        log.info("Fast query done");
        return value;
    }
}
The controller exposing this operation:
package com.example.demo.benchmark;

import lombok.RequiredArgsConstructor;
import org.springframework.web.bind.annotation.GetMapping;
import org.springframework.web.bind.annotation.RestController;

/**
 * Exposes the slow-operation endpoint used by the benchmark.
 *
 * <p>Endpoint contract (must match the README and the test targets):
 * <ul>
 *   <li>{@code GET /api/slow-query} -> {@code 200} {@code "Query executed successfully"}
 *       after ~1s of {@code pg_sleep(1)} blocking on the JDBC connection.</li>
 * </ul>
 */
@RestController
@RequiredArgsConstructor
public class SlowOperationController {

    private final SlowOperationRepository repository;

    /**
     * Executes one {@code pg_sleep(1)} cycle against the PostgreSQL backend.
     *
     * @return a fixed success payload; the observable signal is the wall-clock latency.
     */
    @GetMapping("/api/slow-query")
    public String executeSlowQuery() {
        repository.simulateSlowDatabaseCall();
        return "Query executed successfully";
    }

    /**
     * Runs a fast constant-time query against PostgreSQL.
     *
     * @return a success payload carrying the constant result, so the harness can assert
     *     the call was executed and measure low-latency response time.
     */
    @GetMapping("/fast-query")
    public ResponseDto<Integer> executeFastQuery() {
        log.info("Requesting data from a fast query");
        final int value = slowRepository.fastDatabaseCall();
        return new ResponseDto<>("Fast query executed successfully", Optional.of(value));
    }
}
4.3 Four Configuration Profiles
Rather than relying on in-test property overrides, the benchmark uses four Spring Boot profile YAML files, each pre-configuring both the threading model and the Hikari pool size. Each profile is tested against both endpoints (slow-query and fast-query), yielding eight scenarios:
| Profile | Threading Model | Pool Size | Endpoint | Purpose |
|---|---|---|---|---|
experiment-a |
Platform | 600 | GET /api/slow-query |
Large pool, platform threads, 1s blocking I/O (baseline) |
experiment-a |
Platform | 600 | GET /api/fast-query |
Large pool, platform threads, constant-time probe |
experiment-b |
Platform | 10 | GET /api/slow-query |
Default pool, platform threads, 1s blocking I/O (bottleneck) |
experiment-b |
Platform | 10 | GET /api/fast-query |
Default pool, platform threads, constant-time probe |
experiment-c |
Virtual | 600 | GET /api/slow-query |
Large pool, virtual threads, 1s blocking I/O (unlimited concurrency) |
experiment-c |
Virtual | 600 | GET /api/fast-query |
Large pool, virtual threads, constant-time probe |
experiment-d |
Virtual | 10 | GET /api/slow-query |
Default pool, virtual threads, 1s blocking I/O (pool starvation) |
experiment-d |
Virtual | 10 | GET /api/fast-query |
Default pool, virtual threads, constant-time probe |
The slow-query endpoint executes pg_sleep(1) and holds one Hikari connection for exactly one second — this is the database I/O workload. The fast-query endpoint executes SELECT 1 AS benchmark, a constant-time probe with no I/O latency, isolating the pure threading-model impact. The driver script (run-benchmark.sh) launches the application with --spring.profiles.active=<profile> and verifies the active profile via the application log and a jar-content guard before sending any traffic. A scenario banner printed before each run shows the profile, threading model, pool size, and workload endpoint explicitly.
4.4 Load Generation: k6
k6 generates constant virtual users (VUs) against the application for 60 seconds per concurrency level, with a 5-second graceful stop. Each concurrency level (N = 50, 100, 200, 500) runs as a separate k6 invocation with a unique run ID ($scenario-$N) passed in the X-Benchmark-Run header.
The k6 script records client-side metrics: http_req_duration percentiles (p50, p95, p99), http_reqs throughput (requests/second), and http_req_failed rate. After each run, the script scrapes the application’s /actuator/prometheus endpoint for server-side Micrometer timers, filtered by the run ID tag.
The benchmark driver collects per-scenario artifacts: application log, k6 JSON results, actuator metrics, Prometheus dump, Java Flight Recorder recording, and RSS memory time-series (via pidstat).
4.5 Server-Side Metrics
The application uses Spring Boot Actuator with Micrometer to expose HTTP request percentiles (p50, p95, p99) on /actuator/prometheus. Each request is tagged with the run ID from the X-Benchmark-Run header, enabling per-scenario filtering.
JFR (Java Flight Recorder) runs continuously during each scenario with settings=profile,dumponexit=true,maxsize=2g,maxage=15m, capturing thread-state distributions, CPU samples, and virtual-thread scheduling events for post-hoc analysis. The profile settings add roughly 1-2% CPU overhead, so the throughput numbers in the next section should be read as measured under that light instrumentation — the deltas between thread models are large enough that the conclusion is unaffected.
5. Results and Analysis
5.1 Database Experiment A: Thread Model Under Load (Pool 600)
With a generous connection pool (600 slots, well above PostgreSQL’s max_connections=1000), neither HikariCP nor the database is the binding constraint — that leaves the Tomcat thread pool for platform threads, and effectively no ceiling at all for virtual threads. But the story turns out to be more interesting than that, because the two containers don’t behave the same way.
Tomcat
| Concurrency (N) | Threading Model | Throughput (req/s) | p50 (ms) | p95 (ms) | p99 (ms) |
|---|---|---|---|---|---|
| 50 | Platform | 47.68 | 1007.3 | 1080.8 | 2156.9 |
| 50 | Virtual | 48.09 | 1005.3 | 1074.5 | 2122.2 |
| 200 | Platform | 191.92 | 1004.2 | 1033.0 | 1996.2 |
| 200 | Virtual | 192.07 | 1003.9 | 1035.0 | 1998.6 |
| 500 | Platform | 193.52 | 2091.0 | 3087.1 | 3102.9 |
| 500 | Virtual | 447.87 | 1004.9 | 1966.1 | 2042.2 |
At N=50 and N=200, both models perform identically — the database connection pool is the binding constraint, not the thread model. With pg_sleep(1) holding one connection per request, throughput scales linearly with N until the pool saturates.
At N=500, the models diverge dramatically on Tomcat. Platform threads hit the server.tomcat.threads.max=200 hard ceiling: 300 requests queue behind the 200-thread pool, inflating p50 to 2.1 seconds. Virtual threads have no such cap — all 500 requests execute concurrently, achieving 448 req/s (2.3× platform) with p50 flat at ~1 second.
Jetty
| Concurrency (N) | Threading Model | Throughput (req/s) | p50 (ms) | p95 (ms) | p99 (ms) |
|---|---|---|---|---|---|
| 50 | Platform | 48.02 | 1004.3 | 1075.8 | 2197.0 |
| 50 | Virtual | 48.06 | 1004.5 | 1026.0 | 2192.6 |
| 200 | Platform | 187.90 | 1003.8 | 1184.7 | 2005.7 |
| 200 | Virtual | 191.16 | 1004.2 | 1081.5 | 1981.9 |
| 500 | Platform | 189.49 | 3060.7 | 3127.9 | 3185.7 |
| 500 | Virtual | 192.03 | 2064.8 | 4104.6 | 6155.5 |
On Jetty, the picture is strikingly different. At N=500, virtual threads achieve only 192 req/s versus platform’s 189 req/s — essentially the same throughput. The p50 is lower (2065ms vs 3061ms), but the tail latency is worse (p99 of 6.2 seconds). Virtual threads on Jetty don’t break the ceiling the way they do on Tomcat, which suggests the bottleneck has moved somewhere else — likely Jetty’s own virtual-thread pool configuration (more on this in section 5.5).
This is the core finding: virtual threads break the Tomcat thread-pool ceiling when the connection pool is large enough, but the gain is container-specific. The thread model is a toggle; the pool is the knob; and the container is the wiring that decides whether the toggle actually works.
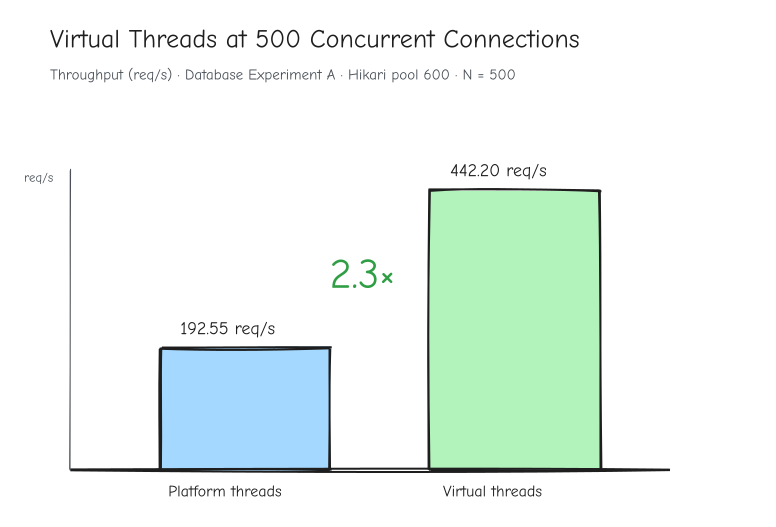
At 500 concurrent connections with a HikariCP pool of 600, Tomcat virtual threads achieved 447.87 req/s versus 193.52 for platform threads — a 2.3× difference. Jetty showed no meaningful gain. (Author’s benchmark data, CC BY 4.0)
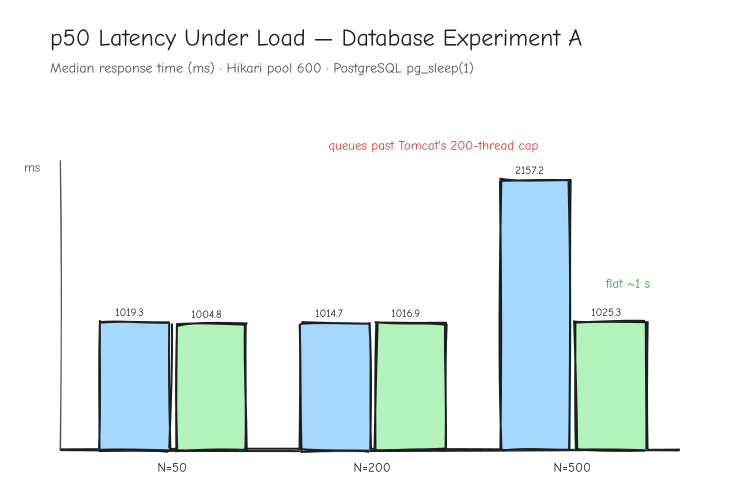
The p50 latency stays near one second for virtual threads on Tomcat while platform-thread latency rises at N=500, after the 200-thread Tomcat limit is reached. (Author’s benchmark data, CC BY 4.0)
5.2 Database Experiment B: The HikariCP Bottleneck (Pool 10)
Reducing maximumPoolSize to 10 — HikariCP’s default — eliminates all differences between threading models:
| Concurrency (N) | Threading Model | Throughput (req/s) | p50 (ms) | p95 (ms) | p99 (ms) |
|---|---|---|---|---|---|
| 50 | Platform | 9.68 | 5117.2 | 9131.3 | 9342.5 |
| 50 | Virtual | 9.65 | 5124.9 | 5337.7 | 9317.2 |
| 200 | Platform | 9.09 | 20230.5 | 33027.8 | 39526.7 |
| 200 | Virtual | 9.08 | 20471.9 | 22531.0 | 39927.6 |
| 500 | Platform | 7.54 | 37693.2 | 61254.9 | 64348.1 |
| 500 | Virtual | 7.38 | 39137.0 | 61860.8 | 63904.1 |
Throughput is capped at ~7-10 req/s regardless of concurrency or threading model — exactly 10 connections × 1 req/s, with the slight drop at N=500 attributable to pool-acquire contention under extreme queuing. The p50 tracks N/10 seconds almost perfectly (5.1s at N=50, 20.2s at N=200, 38.9s at N=500).
This confirms the thesis from section 3: enabling virtual threads without tuning HikariCP yields suboptimal results. The pool size, not the threading model, is the dominant constraint. Virtual threads handle the blocking more efficiently (no OS context switching), but they cannot create database connections that do not exist.
5.3 Fast-Query Endpoint: Connection Pool Sensitivity
The slow-query endpoint conflates thread-model benefits with connection-hold-time effects. To isolate the pure threading-model impact, we added a fast-query endpoint that executes SELECT 1 AS benchmark — a constant-time probe with no I/O latency. This removes the 1-second connection hold entirely, so the only variable is how efficiently the threading model handles concurrency.
Pool 600: Virtual Threads Win
| Server | Concurrency (N) | Platform (req/s) | Virtual (req/s) | Gain |
|---|---|---|---|---|
| Tomcat | 50 | 9,431 | 10,086 | 1.07× |
| Tomcat | 200 | 14,968 | 16,782 | 1.12× |
| Tomcat | 500 | 14,297 | 16,584 | 1.16× |
| Jetty | 50 | 7,782 | 9,205 | 1.18× |
| Jetty | 200 | 13,322 | 15,350 | 1.15× |
| Jetty | 500 | 11,893 | 17,168 | 1.44× |
With 600 connections available, virtual threads consistently outperform platform threads. The gain is modest at low concurrency (7-18%) but grows at N=500, where Jetty reaches 1.44× and Tomcat 1.16×. The thread model is the binding constraint here — virtual threads can schedule more work onto the carrier pool without hitting the OS thread ceiling.
Pool 10: No Difference
| Server | Concurrency (N) | Platform (req/s) | Virtual (req/s) | Gain |
|---|---|---|---|---|
| Tomcat | 50 | 3,664 | 3,698 | 1.01× |
| Tomcat | 200 | 2,773 | 3,917 | 1.41× |
| Tomcat | 500 | 3,371 | 3,864 | 1.15× |
| Jetty | 50 | 3,971 | 3,836 | 0.97× |
| Jetty | 200 | 3,546 | 4,174 | 1.18× |
| Jetty | 500 | 3,794 | 3,701 | 0.98× |
With only 10 connections, both threading models produce roughly the same throughput — around 3,000-4,000 req/s. The connection pool is the ceiling, and no amount of thread-model cleverness can schedule work that has no connection to run on.
This is the cleanest validation of the article’s core thesis: the thread model is a toggle; the pool is the knob. When the pool is large enough to matter, virtual threads win. When it isn’t, they can’t help. And the crossover point is exactly where HikariCP’s default sits — which is why the “just enable virtual threads” advice without pool tuning is incomplete.
5.4 CPU-Bound Workload: Where Virtual Threads Cannot Help
The file-read endpoint reads 256 MiB from tmpfs and computes a per-byte checksum — a purely CPU-bound operation on a 6-core Intel i5-9600K:
| Concurrency (N) | Threading Model | Throughput (req/s) | p50 (ms) | p95 (ms) | p99 (ms) |
|---|---|---|---|---|---|
| 50 | Platform | 56.11 | 959.0 | 1174.5 | 1289.4 |
| 50 | Virtual | 56.17 | 398.0 | 878.2 | 18014.6 |
| 200 | Platform | 57.28 | 3730.9 | 4614.7 | 6459.3 |
| 200 | Virtual | 57.28 | 692.3 | 28738.0 | 60588.9 |
| 500 | Platform | 55.95 | 9011.7 | 12918.1 | 13596.1 |
| 500 | Virtual | 56.82 | 1290.5 | 55544.6 | 62841.7 |
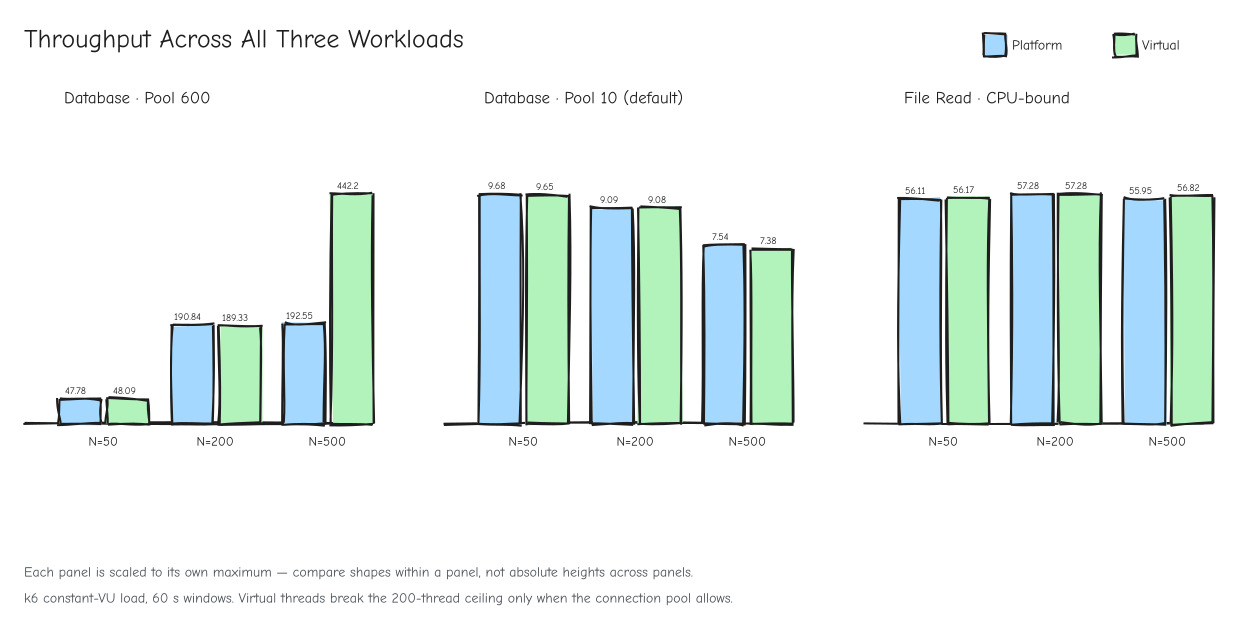
Throughput across all four workload types. Each panel uses its own vertical scale; compare platform and virtual bars within a panel rather than across panels. (Author’s benchmark data, CC BY 4.0)
Throughput is flat at ~56 req/s across all N and both models — the CPU is saturated at 6 cores, and no threading model can execute more than 6 byte-sum loops simultaneously.
The latency story is different. Platform threads show predictable fair-share CFS scaling: p50 = N x 18ms/core (linear, bounded). Virtual threads show a bimodal distribution — low median (418ms at N=500) but extreme tail (p99 up to 63 seconds). This is carrier-thread starvation: the 6 carrier threads (ForkJoinPool-1-worker-*) are monopolized by CPU-bound byte-sum loops, so most virtual threads spend their lifetime waiting for a carrier to become available.
This is the important caveat: virtual threads are designed for I/O-bound work, not CPU-bound work. When the blocking operation is a database call or HTTP request, virtual threads excel. When the work is pure computation, they offer no throughput advantage and can introduce severe tail latency.
5.5 Container Divergence: Tomcat vs. Jetty
Both Tomcat (11.0.22) and Jetty (12.1.10, EE11) were tested with identical configurations, but the results tell a more nuanced story than “containers are interchangeable.”
At low concurrency (N=50, N=200), both servers produce near-identical numbers — the thread model and connection pool dominate, not the container. But at N=500 with virtual threads, a significant gap opens:
Slow-query endpoint (pg_sleep(1)):
| Scenario | Tomcat N=500 | Jetty N=500 |
|---|---|---|
| Platform (pool 600) | 193.52 req/s, p50 2091ms | 189.49 req/s, p50 3061ms |
| Virtual (pool 600) | 447.87 req/s, p50 1005ms | 192.03 req/s, p50 2065ms |
| Platform (pool 10) | 7.54 req/s, p50 37386ms | 9.14 req/s, p50 31631ms |
| Virtual (pool 10) | 7.38 req/s, p50 39223ms | 7.57 req/s, p50 30208ms |
Fast-query endpoint (SELECT 1):
| Scenario | Tomcat N=500 | Jetty N=500 |
|---|---|---|
| Platform (pool 600) | 14,297 req/s, p50 29ms | 11,893 req/s, p50 36ms |
| Virtual (pool 600) | 16,584 req/s, p50 23ms | 17,168 req/s, p50 23ms |
| Platform (pool 10) | 3,371 req/s, p50 127ms | 3,794 req/s, p50 53ms |
| Virtual (pool 10) | 3,864 req/s, p50 107ms | 3,701 req/s, p50 107ms |
The slow-query virtual-thread pool-600 row is the one that jumps out: Tomcat achieves 2.3× the throughput of platform threads, while Jetty shows essentially no gain. On Jetty, virtual threads at N=500 also exhibit worse tail latency (p99 of 6.2 seconds vs Tomcat’s 2.0 seconds), suggesting carrier-thread contention or a different scheduling bottleneck.
The fast-query results tell a different story. With no I/O latency holding connections, both containers benefit from virtual threads — Jetty actually edges ahead at 17,168 req/s versus Tomcat’s 16,584 req/s. The container divergence is an I/O-hold phenomenon, not a fundamental scheduling difference. When the database isn’t the bottleneck, Jetty’s virtual-thread integration works fine.
Configuration quirk: Spring Boot 4.1’s JettyVirtualThreadsWebServerFactoryCustomizer creates a VirtualThreadPool(maxTasks) where maxTasks defaults to server.jetty.threads.max (200). This caps concurrent virtual threads at 200 — defeating the purpose. The fix is server.jetty.threads.max: 0 in the virtual-thread profiles, which removes the cap entirely. Tomcat has no equivalent issue; its TomcatVirtualThreadsWebServerFactoryCustomizer calls ProtocolHandler.setExecutor(VirtualThreadExecutor("tomcat-handler-")) with no cap.
Even with the cap removed, Jetty’s virtual-thread integration doesn’t match Tomcat’s throughput at high concurrency. This could be related to how Jetty’s thread-pool implementation schedules virtual-thread carriers, or to differences in how the two containers handle connection checkout under extreme load. The takeaway: virtual threads are not container-agnostic in practice. If you’re evaluating Jetty as a virtual-thread target, expect to do more tuning than with Tomcat, and expect the ceiling to be lower.
5.6 Resource Cost: Platform vs. Virtual Threads
There is a common claim that virtual threads are dramatically cheaper in memory because a platform thread reserves ~1 MiB of stack. At 500 concurrent requests, that framing suggests ~500 MiB of thread overhead for platform threads versus a fraction of that for virtual threads. I ran the benchmark with pidstat tracking RSS (resident set size — the memory actually committed) so we could measure this instead of trusting the theory. The measured data tells a more honest, and more useful, story:
| Scenario | Thread Model | Peak RSS | Peak VSZ |
|---|---|---|---|
| Experiment A — Tomcat (pool 600) | Platform | 393 MB | 12,770 MB |
| Experiment A — Tomcat (pool 600) | Virtual | 456 MB | 12,575 MB |
| Experiment A — Jetty (pool 600) | Platform | 419 MB | 12,760 MB |
| Experiment A — Jetty (pool 600) | Virtual | 441 MB | 12,578 MB |
| Experiment B — Tomcat (pool 10) | Platform | 376 MB | 12,775 MB |
| Experiment B — Tomcat (pool 10) | Virtual | 415 MB | 12,601 MB |
| Experiment B — Jetty (pool 10) | Platform | 398 MB | 12,760 MB |
| Experiment B — Jetty (pool 10) | Virtual | 401 MB | 12,578 MB |
| Fast-query — Tomcat (pool 600) | Platform | 657 MB | 12,760 MB |
| Fast-query — Tomcat (pool 600) | Virtual | 1,340 MB | 12,580 MB |
| Fast-query — Jetty (pool 600) | Platform | 852 MB | 12,760 MB |
| Fast-query — Jetty (pool 600) | Virtual | 948 MB | 12,577 MB |
| Fast-query — Tomcat (pool 10) | Platform | 532 MB | 12,760 MB |
| Fast-query — Tomcat (pool 10) | Virtual | 521 MB | 12,598 MB |
| Fast-query — Jetty (pool 10) | Platform | 582 MB | 12,760 MB |
| Fast-query — Jetty (pool 10) | Virtual | 852 MB | 12,578 MB |
| File workload | Platform | 425 MB | 12,770 MB |
| File workload | Virtual | 362 MB | 12,611 MB |
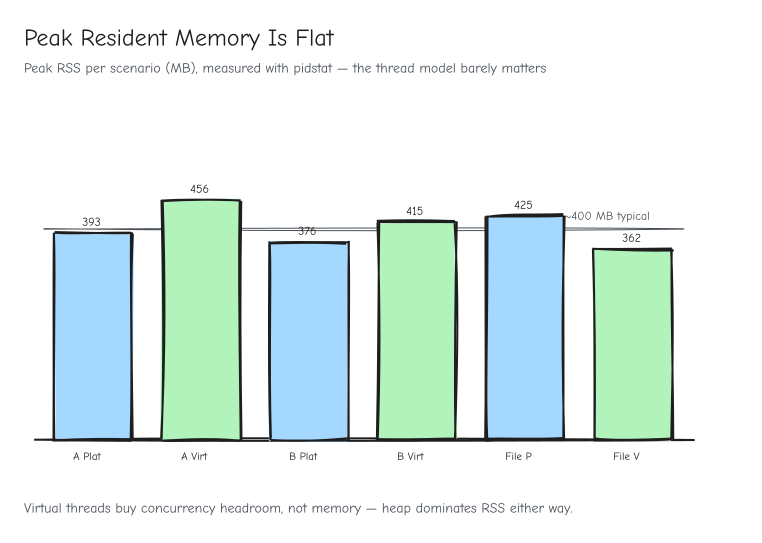
Peak resident memory stays broadly around 400 MB across the scenarios; virtual threads provide concurrency headroom, not a large RSS reduction in this application. (Author’s benchmark data, CC BY 4.0)
Resident memory is broadly similar across the slow-query and file workloads — 362 to 456 MB — regardless of thread model. In the Experiment A case the virtual-thread run actually peaked a little higher in RSS than the platform run (456 vs. 393 MB). For this heap-dominated Spring Boot application, virtual threads are essentially memory-neutral on I/O-bound workloads.
The fast-query scenarios tell a different story. Because SELECT 1 completes in microseconds, k6 pushes orders of magnitude more requests through the JVM, which drives the garbage collector harder and inflates RSS. Tomcat with virtual threads and pool 600 peaked at 1,340 MB — nearly three times the slow-query figure — while platform threads on the same configuration hit 657 MB. Jetty shows a similar pattern (948 MB virtual vs. 852 MB platform). The high throughput itself is the memory cost: more requests means more short-lived objects, more GC cycles, and more committed pages. This is not a virtual-thread overhead per se — it is the JVM responding to sustained high request volume.
The reason is that the ~1 MiB per platform thread is a virtual address reservation, not committed memory. The JVM reserves that stack range, but only the pages actually touched are backed by physical RAM, and the heap, metaspace, and JIT code dominate RSS either way. The VSZ column makes this visible: every scenario, including virtual threads, sits around 12.5 GB of virtual reservation because the heap reservation dwarfs the platform-stack reservation. So the tidy “500x reduction” framing overstates what really happens in a modern JVM.
What the measured data does support is that virtual threads buy you headroom on the metric that matters at high concurrency: the thread-count ceiling. Platform threads at N=500 were capped by Tomcat’s 200-thread limit; virtual threads had no such ceiling. That is a concurrency-limit win, not a memory win. And it comes with a real tradeoff I should flag: when work is CPU-bound (section 5.4), the carrier pool becomes the bottleneck, and virtual threads trade one kind of limit for another.
6. Conclusion
Virtual threads work — but the story is more nuanced than a single throughput number.
On Tomcat with a generous connection pool, virtual threads delivered a 2.3× throughput improvement at 500 concurrent database connections, with flat p50 latency where platform threads queue and degrade. On Jetty, the same configuration showed no meaningful gain — virtual threads are not a drop-in magic bullet, and the container matters.
The fast-query endpoint told the cleanest story: with 600 connections, virtual threads beat platform threads by 1.16-1.44× at high concurrency. With 10 connections, both models produce identical throughput. The thread model is a toggle; the pool is the knob.
But the more important finding is what virtual threads expose: the connection pool is the real bottleneck. Enabling virtual threads on a Spring Boot service with the default HikariCP pool size of 10 gives you ~10 req/s — the same ~10 req/s you would get with platform threads. And if you’re on Jetty, you may need to dig into the container configuration before virtual threads deliver any benefit at all.
For I/O-bound workloads — database queries, HTTP calls, message consumption — virtual threads are a clear win on Tomcat. For CPU-bound work, they offer no throughput advantage and can introduce carrier-thread starvation. Enable virtual threads for I/O-bound endpoints, tune the connection pool to match your database’s capacity, and benchmark your specific container before declaring victory.
In Part 2 of this series, we will explore how to incrementally adopt virtual threads in existing legacy codebases using CompletableFuture, and in Part 3, we will tackle the “WebFlux Reality Check,” demonstrating how virtual threads can elegantly solve the infamous blocking I/O pain points (like filesystem operations and OpenFeign) within reactive pipelines.
7. References
- Goetz, B., Peierls, T., et al. (2006). Java Concurrency in Practice. Addison-Wesley Professional.
- Spring Framework Documentation — Web on Reactive Stack
- JEP 444: Virtual Threads
- Spring Boot Reference — Virtual Threads
- HikariCP Wiki — About Pool Sizing
All benchmark code, the four configuration profiles, the k6 scripts, and the raw results behind every number in this article live in the companion repository: github.com/paulushcgcj/article-java21-threads. If any result here looks suspicious, go check my work.